
Page 64 - MOH Supply and Needs-Based Requirement Hyperlink 02032021
P. 64
EXTENDED EXECUTIVE SUMMARY 56
3.3.3 Gap Analysis
a. Baseline supply and requirement
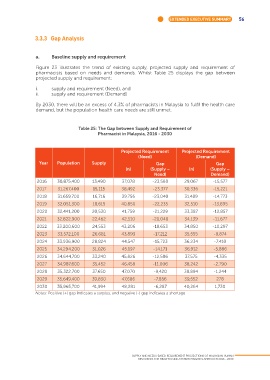
Figure 23 illustrates the trend of existing supply, projected supply and requirement of
pharmacists based on needs and demands. Whilst Table 25 displays the gap between
projected supply and requirement:
i. supply and requirement (Need), and
ii. supply and requirement (Demand)
By 2030, there will be an excess of 4.3% of pharmacists in Malaysia to fulfil the health care
demand, but the population health care needs are still unmet.
Table 25: The Gap between Supply and Requirement of
Pharmacist in Malaysia, 2016 - 2030
Projected Requirement Projected Requirement
(Need) (Demand)
Year Population Supply Gap Gap
(n) (Supply – (n) (Supply –
Need) Demand)
2016 30,875,400 13,490 37,078 -23,588 29,067 -15,577
2017 31,267,400 15,115 38,492 -23,377 30,336 -15,221
2018 31,659,700 16,716 39,756 -23,040 31,489 -14,773
2019 32,051,300 18,615 40,850 -22,235 32,510 -13,895
2020 32,441,200 20,530 41,759 -21,229 33,387 -12,857
2021 32,822,900 22,462 42,510 -20,048 34,139 -11,677
2022 33,200,600 24,553 43,206 -18,653 34,850 -10,297
2023 33,572,100 26,681 43,893 -17,212 35,555 -8,874
2024 33,936,900 28,824 44,547 -15,723 36,234 -7,410
2025 34,294,200 31,026 45,197 -14,171 36,912 -5,886
2026 34,644,700 33,240 45,826 -12,586 37,575 -4,335
2027 34,987,600 35,452 46,458 -11,006 38,242 -2,790
2028 35,322,700 37,650 47,070 -9,420 38,894 -1,244
2029 35,649,400 39,830 47,686 -7,856 39,552 278
2030 35,965,700 41,994 48,281 -6,287 40,264 1,730
Notes: Positive (+) gap indicates a surplus, and negative (-) gap indicates a shortage
SUPPLY AND NEEDS-BASED REQUIREMENT PROJECTIONS OF MALAYSIAN HUMAN
RESOURCES FOR HEALTH USING SYSTEM DYNAMICS APPROACH 2016 - 2030