
Page 62 - MOH Supply and Needs-Based Requirement Hyperlink 02032021
P. 62
EXTENDED EXECUTIVE SUMMARY 54
3.3. PHARMACIST
3.3.1 Pharmacist Supply Projection
This study identified two components in pharmacy care requirement, which was direct
patient care and indirect patient care. Direct patient care services are defined as pharmacists
dealing direct patient contact upon delivering pharmacy services, which were further
divided into two services; namely, outpatient care services and in-patient care services,
where their working scenario and job scope are distinctly different. Substantial numbers
of pharmacists are involved in the in-direct patient services in Malaysia, which makes
up to 40% of total pharmacists. This is calculated based on the number of registered
pharmacists registered in 2015 working in pharmacy management, enforcement pharmacy,
regulatory pharmacy, drug information services, pharmaceutical industry, academia and
research. To tabulate the total number of pharmacists required based on need and demand,
the number of indirect pharmacists were added to the figure produced by the model.
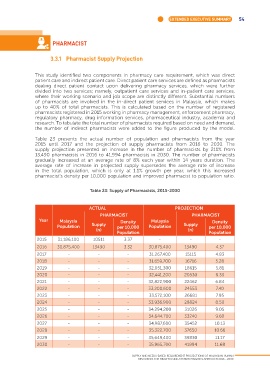
Table 23 presents the actual number of population and pharmacists from the year
2015 until 2017 and the projection of supply pharmacists from 2016 to 2030. The
supply projection presented an increase in the number of pharmacists by 211% from
13,490 pharmacists in 2016 to 41,994 pharmacists in 2030. The number of pharmacists
gradually increased at an average rate of 8% each year within 14 years duration. The
average rate of increase in projected supply supersedes the average rate of increase
in the total population, which is only at 1.1% growth per year, which this increased
pharmacist’s density per 10,000 population and improved pharmacist to population ratio.
Table 23: Supply of Pharmacists, 2015-2030
ACTUAL PROJECTION
PHARMACIST PHARMACIST
Year Malaysia Density Malaysia Density
Population Supply per 10,000 Population Supply per 10,000
(n) (n)
Population Population
2015 31,186,100 10511 3.37 - - -
2016 30,875,400 13490 3.32 30,875,400 13490 4.37
2017 - - - 31,267,400 15115 4.83
2018 - - - 31,659,700 16716 5.28
2019 - - - 32,051,300 18615 5.81
2020 - - - 32,441,200 20530 6.33
2021 - - - 32,822,900 22462 6.84
2022 - - - 33,200,600 24553 7.40
2023 - - - 33,572,100 26681 7.95
2024 - - - 33,936,900 28824 8.50
2025 - - - 34,294,200 31026 9.05
2026 - - - 34,644,700 33240 9.60
2027 - - - 34,987,600 35452 10.13
2028 - - - 35,322,700 37650 10.66
2029 - - - 35,649,400 39830 11.17
2030 - - - 35,965,700 41994 11.68
SUPPLY AND NEEDS-BASED REQUIREMENT PROJECTIONS OF MALAYSIAN HUMAN
RESOURCES FOR HEALTH USING SYSTEM DYNAMICS APPROACH 2016 - 2030