
Page 65 - MOH Supply and Needs-Based Requirement Hyperlink 02032021
P. 65
57 EXTENDED EXECUTIVE SUMMARY
b. Supply scenario
Scenario analysis was carried out to assess the impact of change in certain parameters on
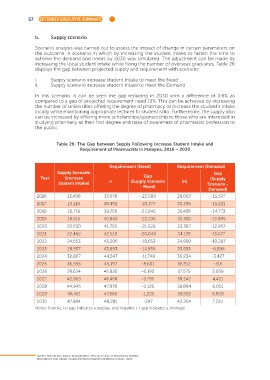
the outcome. A scenario in which by increasing the student intake to fasten the time to
achieve the demand and needs by 2030 was simulated. The adjustment can be made by
increasing the local student intake while fixing the number of overseas graduates. Table 26
displays the gap between projected supply and requirement with scenario:
i. Supply scenario increase student intake to meet the Need
ii. Supply scenario increase student intake to meet the Demand
In this scenario, it can be seen the gap reducing in 2030 with a difference of 0.6% as
compared to a gap of projected requirement need 13%. This can be achieved by increasing
the number of universities offering the degree of pharmacy or increase the student’s intake
locally while maintaining appropriate lecturer to student ratio. Furthermore, the supply also
can be increased by offering more scholarships/sponsorship to those who are interested in
studying pharmacy as their first degree and raise of awareness of pharmacist profession to
the public.
Table 26: The Gap between Supply Following Increase Student Intake and
Requirement of Pharmacists in Malaysia, 2016 – 2030
Requirement (Need) Requirement (Demand)
Supply Scenario Gap
Year (increase Gap (Supply
student intake) n (Supply Scenario (n) Scenario -
- Need)
Demand)
2016 13,490 37,078 -23,588 29,067 -15,577
2017 15,115 38,492 -23,377 30,336 -15,221
2018 16,716 39,756 -23,040 31,489 -14,773
2019 18,615 40,850 -22,235 32,510 -13,895
2020 20,530 41,759 -21,229 33,387 -12,857
2021 22,462 42,510 -20,048 34,139 -11,677
2022 24,553 43,206 -18,653 34,850 -10,297
2023 28,957 43,893 -14,936 35,555 -6,598
2024 32,807 44,547 -11,740 36,234 -3,427
2025 36,596 45,197 -8,601 36,912 -316
2026 39,634 45,826 -6,192 37,575 2,059
2027 42,663 46,458 -3,795 38,242 4,421
2028 44,945 47,070 -2,125 38,894 6,051
2029 46,461 47,686 -1,225 39,552 6,909
2030 47,984 48,281 -297 40,264 7,720
Notes: Positive (+) gap indicates a surplus, and negative (-) gap indicates a shortage
SUPPLY AND NEEDS-BASED REQUIREMENT PROJECTIONS OF MALAYSIAN HUMAN
RESOURCES FOR HEALTH USING SYSTEM DYNAMICS APPROACH 2016 - 2030