
Page 63 - MOH Supply and Needs-Based Requirement Hyperlink 02032021
P. 63
55 EXTENDED EXECUTIVE SUMMARY
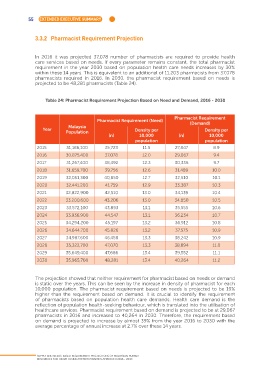
3.3.2 Pharmacist Requirement Projection
In 2016 it was projected 37,078 number of pharmacists are required to provide health
care services based on needs. If every parameter remains constant, the total pharmacist
requirement in the year 2030 based on population health care needs increases by 30%
within these 14 years. This is equivalent to an additional of 11,203 pharmacists from 37,078
pharmacists required in 2016. In 2030, the pharmacist requirement based on needs is
projected to be 48,281 pharmacists (Table 24).
Table 24: Pharmacist Requirement Projection Based on Need and Demand, 2016 - 2030
Pharmacist Requirement
Pharmacist Requirement (Need) (Demand)
Malaysia
Year Density per Density per
Population
(n) 10,000 (n) 10,000
population population
2015 31,186,100 35,723 11.5 27,847 8.9
2016 30,875,400 37,078 12.0 29,067 9.4
2017 31,267,400 38,492 12.3 30,336 9.7
2018 31,659,700 39,756 12.6 31,489 10.0
2019 32,051,300 40,850 12.7 32,510 10.1
2020 32,441,200 41,759 12.9 33,387 10.3
2021 32,822,900 42,510 13.0 34,139 10.4
2022 33,200,600 43,206 13.0 34,850 10.5
2023 33,572,100 43,893 13.1 35,555 10.6
2024 33,936,900 44,547 13.1 36,234 10.7
2025 34,294,200 45,197 13.2 36,912 10.8
2026 34,644,700 45,826 13.2 37,575 10.9
2027 34,987,600 46,458 13.3 38,242 10.9
2028 35,322,700 47,070 13.3 38,894 11.0
2029 35,649,400 47,686 13.4 39,552 11.1
2030 35,965,700 48,281 13.4 40,264 11.2
The projection showed that neither requirement for pharmacist based on needs or demand
is static over the years. This can be seen by the increase in density of pharmacist for each
10,000 population. The pharmacist requirement based on needs is projected to be 19%
higher than the requirement based on demand. It is crucial to identify the requirement
of pharmacists based on population health care demands. Health care demand is the
reflection of population health-seeking behaviour, which is translated into the utilisation of
healthcare services. Pharmacist requirement based on demand is projected to be at 29,067
pharmacists in 2016 and increased to 40,264 in 2030. Therefore, the requirement based
on demand is projected to increase by almost 39% from the year 2016 to 2030 with the
average percentage of annual increase at 2.7% over these 14 years.
SUPPLY AND NEEDS-BASED REQUIREMENT PROJECTIONS OF MALAYSIAN HUMAN
RESOURCES FOR HEALTH USING SYSTEM DYNAMICS APPROACH 2016 - 2030