
Page 59 - MOH Supply and Needs-Based Requirement Hyperlink 02032021
P. 59
51 EXTENDED EXECUTIVE SUMMARY
b. Requirement Scenario
Requirement scenario was carried out to compare the gaps from the chosen scenario. A
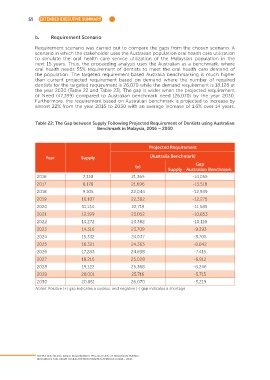
scenario in which the stakeholder uses the Australian population oral health care utilization
to simulate the oral health care service utilization of the Malaysian population in the
next 15 years. Thus, the proceeding analysis uses the Australian as a benchmark, where
oral health needs 55% requirement of dentists to meet the oral health care demand of
the population. The targeted requirement based Australia benchmarking is much higher
than current projected requirement based on demand where the number of required
dentists for the targeted requirement is 26,070 while the demand requirement is 18,128 at
the year 2030 (Table 22 and Table 23). The gap is wider when the projected requirement
of Need (47,399) compared to Australian benchmark need (26,070) by the year 2030.
Furthermore, the requirement based on Australian benchmark is projected to increase by
almost 22% from the year 2016 to 2030 with an average increase of 1.6% over 14 years.
Table 22: The Gap between Supply Following Projected Requirement of Dentists using Australian
Benchmark in Malaysia, 2016 – 2030
Projected Requirement
Year Supply (Australia Benchmark)
Gap
(n)
Supply - Australian Benchmark
2016 7,310 21,365 -14,055
2017 8,178 21,696 -13,518
2018 9,105 22,044 -12,939
2019 10,107 22,382 -12,275
2020 11,134 22,719 -11,585
2021 12,199 23,052 -10,853
2022 13,272 23,382 -10,110
2023 14,316 23,709 -9,393
2024 15,332 24,037 -8,705
2025 16,321 24,363 -8,042
2026 17,283 24,698 -7,415
2027 18,216 25,028 -6,812
2028 19,122 25,368 -6,246
2029 20,001 25,716 -5,715
2030 20,851 26,070 -5,219
Notes: Positive (+) gap indicates a surplus, and negative (-) gap indicates a shortage
SUPPLY AND NEEDS-BASED REQUIREMENT PROJECTIONS OF MALAYSIAN HUMAN
RESOURCES FOR HEALTH USING SYSTEM DYNAMICS APPROACH 2016 - 2030