Page 77 - MOH Supply and Needs-Based Requirement Hyperlink 02032021
P. 77

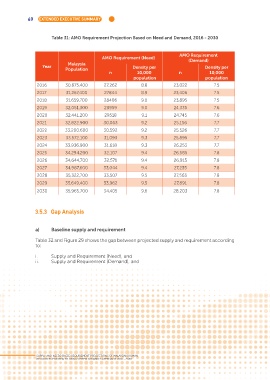
69   EXTENDED EXECUTIVE SUMMARY


                         Table 31: AMO Requirement Projection Based on Need and Demand, 2016 - 2030


                                                                                   AMO Requirement
                                               AMO Requirement (Need)                  (Demand)
                                Malaysia
                    Year                                     Density per                      Density per
                               Population
                                                   n           10,000             n             10,000
                                                              population                      population
                  2016         30,875,400       27,262           8.8            23,022            7.5

                  2017         31,267,400       27844            8.9            23,406            7.5
                  2018         31,659,700       28406            9.0            23,895            7.5
                  2019         32,051,300       28959            9.0            24,335            7.6
                  2020         32,441,200       29518            9.1            24,745            7.6
                  2021         32,822,900       30,063           9.2            25,156            7.7
                  2022         33,200,600       30,592           9.2            25,526            7.7
                  2023         33,572,100       31,093           9.3            25,895            7.7
                  2024         33,936,900       31,618           9.3            26,253            7.7
                  2025         34,294,200       32,107           9.4            26,585            7.8

                  2026         34,644,700       32,571           9.4            26,915            7.8
                  2027         34,987,600       33,044           9.4            27,235            7.8
                  2028         35,322,700       33,507           9.5            27,563            7.8
                  2029         35,649,400       33,962           9.5            27,891            7.8
                  2030         35,965,700       34,405           9.6            28,203            7.8


                 3.5.3  Gap Analysis


                 a)     Baseline supply and requirement

                 Table 32 and Figure 29 shows the gap between projected supply and requirement according
                 to:

                 i.     Supply and Requirement (Need), and
                 ii.    Supply and Requirement (Demand), and


                  SUPPLY AND NEEDS-BASED REQUIREMENT PROJECTIONS OF MALAYSIAN HUMAN
                  RESOURCES FOR HEALTH USING SYSTEM DYNAMICS APPROACH 2016 - 2030
   72   73   74   75   76   77   78   79   80   81   82