Page 143 - FIGHT AGAINST UNCERTAINTY 5 FEB 2021
P. 143

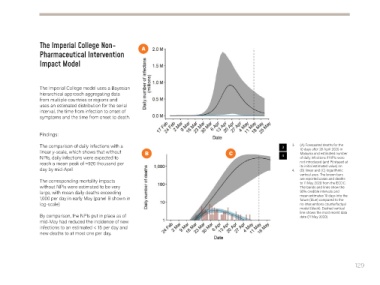
The Imperial College Non-                     A

                   Pharmaceutical Intervention

                   Impact Model


                   The Imperial College model uses a Bayesian
                   hierarchical approach aggregating data
                   from multiple countries or regions and
                   uses an estimated distribution for the serial
                   interval, the time from infection to onset of
                   symptoms and the time from onset to death.


                   Findings:


                   The comparison of daily infections with a                                                                     3    3.   (A) Forecasted deaths for the
                   linear y-scale, which shows that without        B                                     C                               10 days after 26 April 2020 in
                                                                                                                                         Malaysia and estimated number
                   NPIs, daily infections were expected to                                                                       4       of daily infections if NPIs were
                   reach a mean peak of ~920 thousand per                                                                                not introduced (and Rt stayed at
                                                                                                                                         its initial estimated value) on
                   day by mid-April                                                                                                   4.   (B) linear and (C) logarithmic
                                                                                                                                         vertical axes. The brown bars
                   The corresponding mortality impacts                                                                                   are reported cases and deaths
                                                                                                                                         to 11 May 2020 from the ECDC.
                   without NPIs were estimated to be very                                                                                The bands and lines show the
                   large, with mean daily deaths exceeding                                                                               95% credible intervals and
                   1,000 per day in early May (panel B shown in                                                                          mean estimates 10 days into the
                                                                                                                                         future (blue) compared to the
                   log-scale)                                                                                                            no interventions counterfactual
                                                                                                                                         model (black). Dashed vertical
                                                                                                                                         line shows the most recent data
                   By comparison, the NPIs put in place as of                                                                            date (11 May 2020).
                   mid-May had reduced the incidence of new
                   infections to an estimated < 15 per day and
                   new deaths to at most one per day.


                                                                                                                                                                   129
   138   139   140   141   142   143   144   145   146   147   148